
Key Takeaways
- A printable US state map is a versatile teaching tool for geography learning at home or in school
- Hands-on activities help kids remember state locations, capitals, and interesting facts
- Combining coloring with learning improves information retention and makes geography fun
- Free printable maps can be used for tracking travel, educational games, and displaying knowledge
- Activities can be adapted for different grade levels from elementary through middle school
- Integrating maps with other subjects like history and science creates deeper learning experiences

Table of Contents
- Introduction to Map-Based Learning
- State Identification Challenge
- Regional Coloring Activity
- State Capitals Memory Game
- Historical Journey Timeline
- US Geography Scavenger Hunt
- State Facts Trading Cards
- Weather and Climate Mapping
- Population Density Visualization
- Natural Resources Map Project
- State Symbols Exploration
- Travel Planning Adventure
- Famous Landmarks Labeling
- State Borders Challenge
- US Geography Quiz Show
- Connecting Maps to Other Subjects
- Frequently Asked Questions
Introduction to Map-Based Learning
Learning geography doesn't have to be boring! As a geography teacher for over 15 years, I've found that kids learn best when they can touch, color, and interact with maps. A simple printable US map can become the starting point for dozens of fun learning activities. When I first started teaching fourth grade, I noticed my students struggled to remember state locations. Everything changed when I brought in outline maps and turned learning into a hands-on experience.
State Identification Challenge
The most basic but important activity is simply learning to identify all 50 states on the map. This foundational skill helps with all other geography learning. Here's how to turn state identification into a fun challenge:
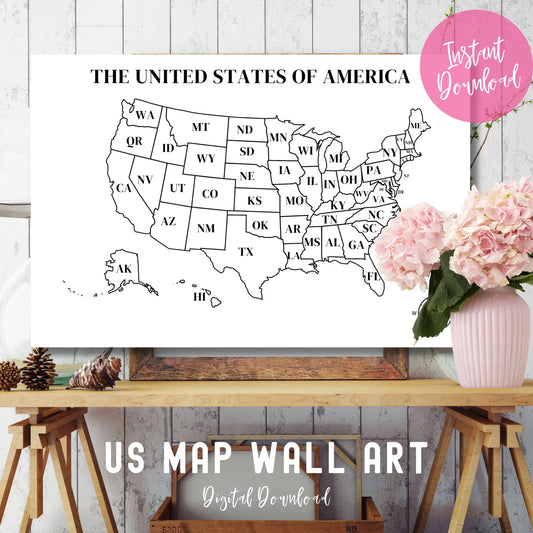
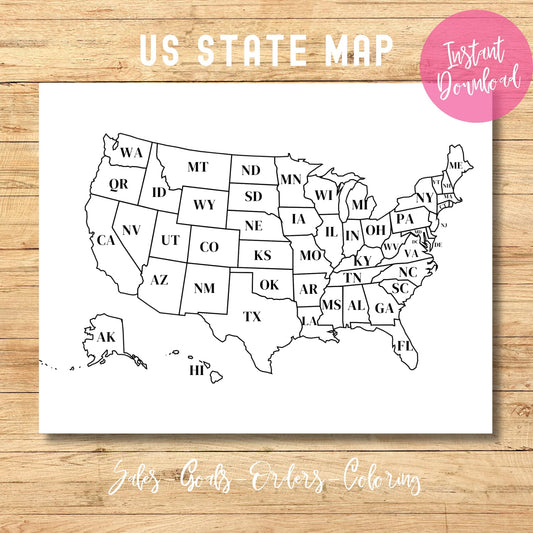
- Print a blank US map for each student
- Start with one region (like the West Coast or New England)
- Have students color each state a different color
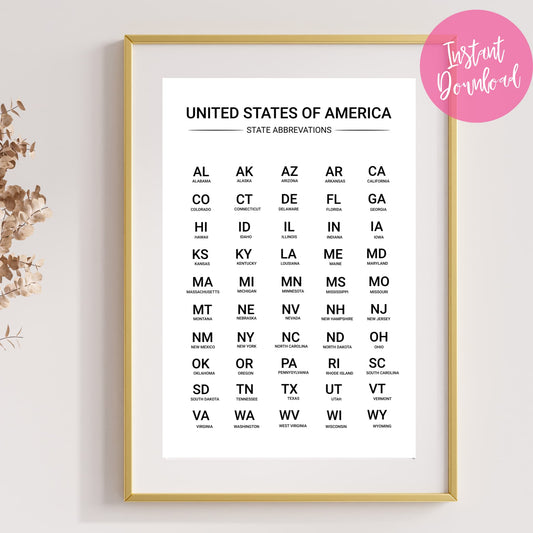
- Label each state with its full name (not just abbreviation)
- Add the capital city with a star symbol
- Time students as they identify states, trying to beat their personal best
Regional Coloring Activity
Dividing the US map into regions makes geography more manageable and helps students understand how states relate to each other. This coloring activity teaches regional geography in a hands-on way.Standard US Regions:
- 🟡 Northeast (yellow)
- 🟢 Southeast (green)
- 🔵 Midwest (blue)
- 🟠 Southwest (orange)
- 🔴 West (red)
- 🟣 Pacific (purple)
- Print the free US map for each student
- Create a color key for the regions
- Have students color each region according to the key
- Discuss what makes each region unique (climate, landforms, resources)
- For older students, add facts about each region's economy and culture

State Capitals Memory Game
Learning state capitals can be challenging, but turning it into a memory game makes it much more enjoyable. This activity combines the printable map with homemade flashcards for an effective learning experience. To create the game:- Print one US map as a reference board
- Create flashcards with state names on one side and capitals on the other
- Start with 10 states, gradually adding more as students master them
- Place state cards face down in one pile, capitals in another
- Students draw one from each pile and must determine if they match
- If correct, they color that state on their map
- The goal is to color the entire map by making correct matches

Historical Journey Timeline
The order in which states joined the Union tells the story of America's growth and expansion. This activity transforms your printable map into a visual timeline of US history. Here's how to create a historical journey map:- Print the US state map
- Research the date each state joined the Union
- Create a color code based on time periods:
- Original 13 colonies (1787-1790): Red
- Early expansion (1791-1850): Orange
- Mid-century additions (1851-1900): Yellow
- Modern states (1901-1959): Green
- Color each state according to when it joined
- Add the year of statehood to each state


US Geography Scavenger Hunt
Turn learning into an adventure with a geography scavenger hunt! This activity gets kids searching for geographic information and applying it to their maps. To set up your scavenger hunt:- Create a list of geographic features to find (Mississippi River, Rocky Mountains, Great Lakes)
- Include state facts (largest state, smallest state, your home state)
- Add historical locations (Plymouth Rock, Independence Hall, Golden Gate Bridge)
- Have students find and mark each item on their map with symbols
- Create a map key explaining all symbols

Teacher Tip! 📝
Make multiple copies of your printable US map at the beginning of the school year. Store them in folders for different subjects. This way, you'll always have maps ready for spontaneous geography lessons or cross-curricular activities!
State Facts Trading Cards
This creative project combines art, research, and geography while creating a collectible set of state cards that students can trade and learn from. To create state trading cards:- Cut card-sized paper rectangles (index cards work great)
- Assign each student several states to research
- On one side, draw the state shape from the map
-
On the reverse, include:
- State name and capital
- Population and major cities
- Famous landmarks
- Interesting facts (state bird, flower, motto)
- Decorate cards with colors and small illustrations
- Laminate for durability
- Have a trading session where students exchange and collect cards

Weather and Climate Mapping
Weather patterns and climate zones are perfect for teaching how geography affects daily life. This map activity connects science with geography in a relevant way.US Climate Zones for Mapping:
- 🌴 Tropical (southern Florida, Hawaii)
- 🏜️ Desert (Southwest)
- 🌊 Mediterranean (California coast)
- ☀️ Humid subtropical (Southeast)
- 🌽 Continental (Midwest, Northeast)
- ❄️ Subarctic (Alaska)
- Print several copies of the US map
- On one map, color climate zones according to the guide above
- On another map, track current temperatures across the country for a week
- Compare the weather patterns to the climate zones
- Discuss how mountains, oceans, and latitude affect climate

Population Density Visualization
Understanding where people live (and why) is a fascinating aspect of human geography. This activity transforms the US map into a visual representation of population patterns. To create a population density map:- Research population data for each state
- Create a shading scale:
- Under 2 million: Light yellow
- 2-5 million: Light orange
- 5-10 million: Dark orange
- 10-20 million: Light red
- Over 20 million: Dark red
- Color each state according to its population
- Mark the 10 largest cities with dots
- Discuss why people cluster in certain areas

Natural Resources Map Project
America's varied landscape provides different natural resources across regions. This mapping activity helps students understand the connection between geography and economics.| Resource Type | Examples | Regions |
|---|---|---|
| Agriculture | Corn, wheat, fruits | Midwest, California, Florida |
| Energy | Oil, coal, natural gas | Texas, Alaska, Wyoming |
| Minerals | Gold, copper, iron | Western states, Great Lakes region |
| Timber | Pine, oak, redwood | Pacific Northwest, Southeast |
| Fishing | Salmon, lobster, crab | Alaska, New England, Gulf Coast |
- Research major resources in different states using the table above
- Create symbols for each resource type
- Mark resources on the map using these symbols
- Draw connections between resources and major industries
- Discuss how geography determines what resources are available


State Symbols Exploration
Every state has official symbols that represent its unique identity. This mapping activity introduces students to these symbols while practicing geography skills. For the state symbols project:-
Research official symbols for each state:
- State animal
- State bird
- State flower
- State tree
- Create a set of tiny drawings or printouts of these symbols
- Place each symbol on its state on the map
- For younger students, focus on just one category (all state birds)
- For older students, research why each symbol was chosen


Travel Planning Adventure
Planning a pretend road trip is not only fun—it teaches map skills, distance calculation, and budgeting while sparking interest in different parts of the country. To plan a virtual road trip:- Choose a starting point and destination on the US map
- Plot a route through at least 5 states
- Research attractions in each state along the route
- Calculate total mileage and driving time
- Create a budget for gas, food, and attractions
- Mark the complete route on the map

Famous Landmarks Labeling
The United States is home to incredible natural and man-made landmarks. This activity helps students locate and learn about these iconic sites. To create a landmarks map:-
Research famous landmarks across the country:
- Natural wonders (Grand Canyon, Niagara Falls)
- Monuments (Statue of Liberty, Mount Rushmore)
- Historic sites (Independence Hall, Alamo)
- Create small pictures or symbols for each landmark
- Place each on the correct state on the map
- Add a brief fact about each landmark
- Connect landmarks to historical events when applicable


State Borders Challenge
Understanding why state borders exist where they do reveals fascinating historical and geographical stories. This activity explores the reasons behind America's state boundaries. For the borders challenge:- Identify different types of state borders on the map:
- Natural borders (rivers, mountain ranges)
- Straight-line borders (surveyed boundaries)
- Latitude/longitude borders
- Research the stories behind unusual borders
- Color-code borders by type
- Discuss how geography and history determined these boundaries

US Geography Quiz Show
Turn geography review into an exciting game show format! This activity makes assessment fun while reinforcing everything students have learned about US geography. To create your quiz show:- Divide students into teams
-
Create questions in categories:
- State identification
- Capitals
- Landmarks
- Borders and regions
- State facts
- Award points for correct answers
- Use the map as a visual aid during the game
- Include "lightning rounds" where teams race to identify states

Connecting Maps to Other Subjects
Geography doesn't exist in isolation—it connects to every other subject! This final activity shows how to use your US map across the curriculum.Cross-curricular mapping ideas:
- History: Track the paths of explorers, the Underground Railroad, or Civil Rights Movement
- Literature: Mark settings of famous American novels or authors' birthplaces
- Science: Map ecosystem types, endangered species habitats, or geological features
- Math: Calculate distances between cities, state areas, or population densities
- Art: Create a mixed-media map incorporating photos, drawings, and text

Frequently Asked Questions
What age group are these US geography activities best for?
Most activities can be adapted for students ages 7-14 (grades 2-8). Younger children might focus on basic state identification and simple coloring activities, while older students can handle more complex projects involving research, historical connections, and data visualization.
How can I adapt these activities for different learning styles?
Visual learners benefit from coloring and symbol activities. Kinesthetic learners enjoy hands-on projects like creating trading cards or 3D maps. Auditory learners might prefer the quiz show format. Most activities incorporate multiple learning styles for broader engagement.
Do I need special materials for these geography activities?
Most activities require only the free printable US map, colored pencils or markers, and basic research resources. Some projects might use index cards, poster board, or craft supplies, but expensive materials aren't necessary for effective learning.
How can parents use these activities for homeschooling?
Parents can follow the same instructions, scaling activities to fit their child's needs. The projects work well for individual learning and can be incorporated into broader unit studies on American history, science, or literature.
How long does each activity typically take?
Simple activities like basic state identification or regional coloring can be completed in 20-30 minutes. More complex projects like trading cards or research-based activities might extend over several days or become ongoing projects throughout a unit.
Can these activities align with state education standards?
Yes! These activities align with standard elementary and middle school social studies requirements for US geography. They cover state identification, regions, physical features, human geography concepts, and connections to history—all common elements in state standards.
How can I assess learning from these map activities?
Besides traditional quizzes, assessment can include completed project quality, presentations, written reflections, or application of knowledge to new contexts. The quiz show format offers a fun assessment alternative.
Where can I find accurate information for these geography projects?
Reliable sources include school textbooks, library reference books, state government websites, the U.S. Census Bureau, and educational websites like National Geographic Kids. Always verify information from multiple sources.